


PGF/TikZ provides a convenient mechanism for plotting functions using GNUPLOT. To run this example for the first time you have to do the following:
- GNUPLOT must be installed on your system. Try typing gnuplot on the command line to see if it's installed. Windows users may have to rename wgnuplot to gnuplot.
- You must allow TeX to run external programs. The command line option to enable this is usually --shell-escape or --enable-write18
PGF will call GNUPLOT for you and store the data in a file. Next time you compile the example, data will be loaded from the generated file. See section 11.12.3 in the manual for more information.
Author: Till Tantau Source: The PGF/TikZ manual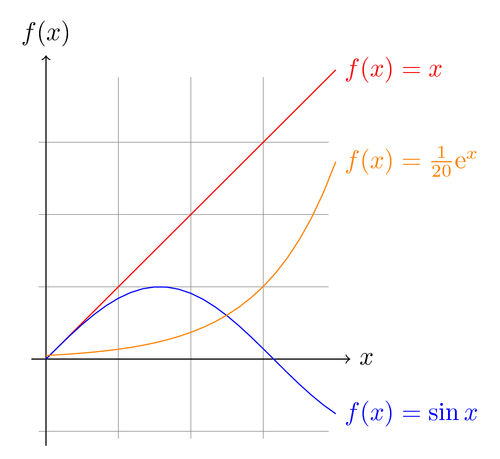
Edit and compile if you like:
% Author: Till Tantau
% Source: The PGF/TikZ manual
\documentclass{article}

\usepackage[latin1]{inputenc}
\usepackage{tikz}

% GNUPLOT required


\begin{document}
\pagestyle{empty}


\begin{tikzpicture}[domain=0:4]
    \draw[very thin,color=gray] (-0.1,-1.1) grid (3.9,3.9);
    \draw[->] (-0.2,0) -- (4.2,0) node[right] {$x$};
    \draw[->] (0,-1.2) -- (0,4.2) node[above] {$f(x)$};
    \draw[color=red] plot[id=x] function{x}
        node[right] {$f(x) =x$};
    \draw[color=blue] plot[id=sin] function{sin(x)}
        node[right] {$f(x) = \sin x$};
    \draw[color=orange] plot[id=exp] function{0.05*exp(x)}
        node[right] {$f(x) = \frac{1}{20} \mathrm e^x$};
\end{tikzpicture}


\end{document}
Click to download: gnuplot-basics.tex • gnuplot-basics.pdf
Open in Overleaf: gnuplot-basics.tex